Total Expenditure in Alberta
$51 Million (2025
Passport holders
30 Million (2025)
23% of total population
Potential market size
2.5 Million (2025)
Overview
Mexico’s economy is expected to see GDP growth between 1.3–1.8% in 2026, reflecting a gradual recovery following weaker performance in 2025. Growth is supported by strong U.S. demand and resilient domestic consumption, though headwinds remain from elevated inflation, fiscal consolidation, and policy uncertainty. Inflation is expected to remain above the central bank’s 3% target in the near term.
On this page:
Economic Indicators
Indicator | 2024 | 2025 | 2026 Forecasted | 2027 Forecasted | 2028 Forecasted |
|---|---|---|---|---|---|
GDP - per capita (US$) | $14,156 | $14,102 | $16,059 | $16,054 | $16,128 |
GDP - YoY Growth Rate | 1.23% | 0.79% | 1.26% | 1.86% | 2.16% |
Exchange Rate (MXN/CAD) (annual average) | $0.075 | $0.073 | N/A | N/A | N/A |
Unemployment Rate (annual average) | 2.69% | 2.76% | N/A | N/A | N/A |
Annual inflation | 4.57% | 3.81% | 4.22% | 3.58% | 3.64% |
Quarterly traveller spend

Traveller Characteristics
Where are travellers spending their money?

Why won't travellers come here? | |
|---|---|
Poor weather | 31% |
Cost | 28% |
Visa requirements | 28% |
Extreme weather conditions | 25% |
Too cold | 24% |
Top 5 trip anchors (market size) | |
|---|---|
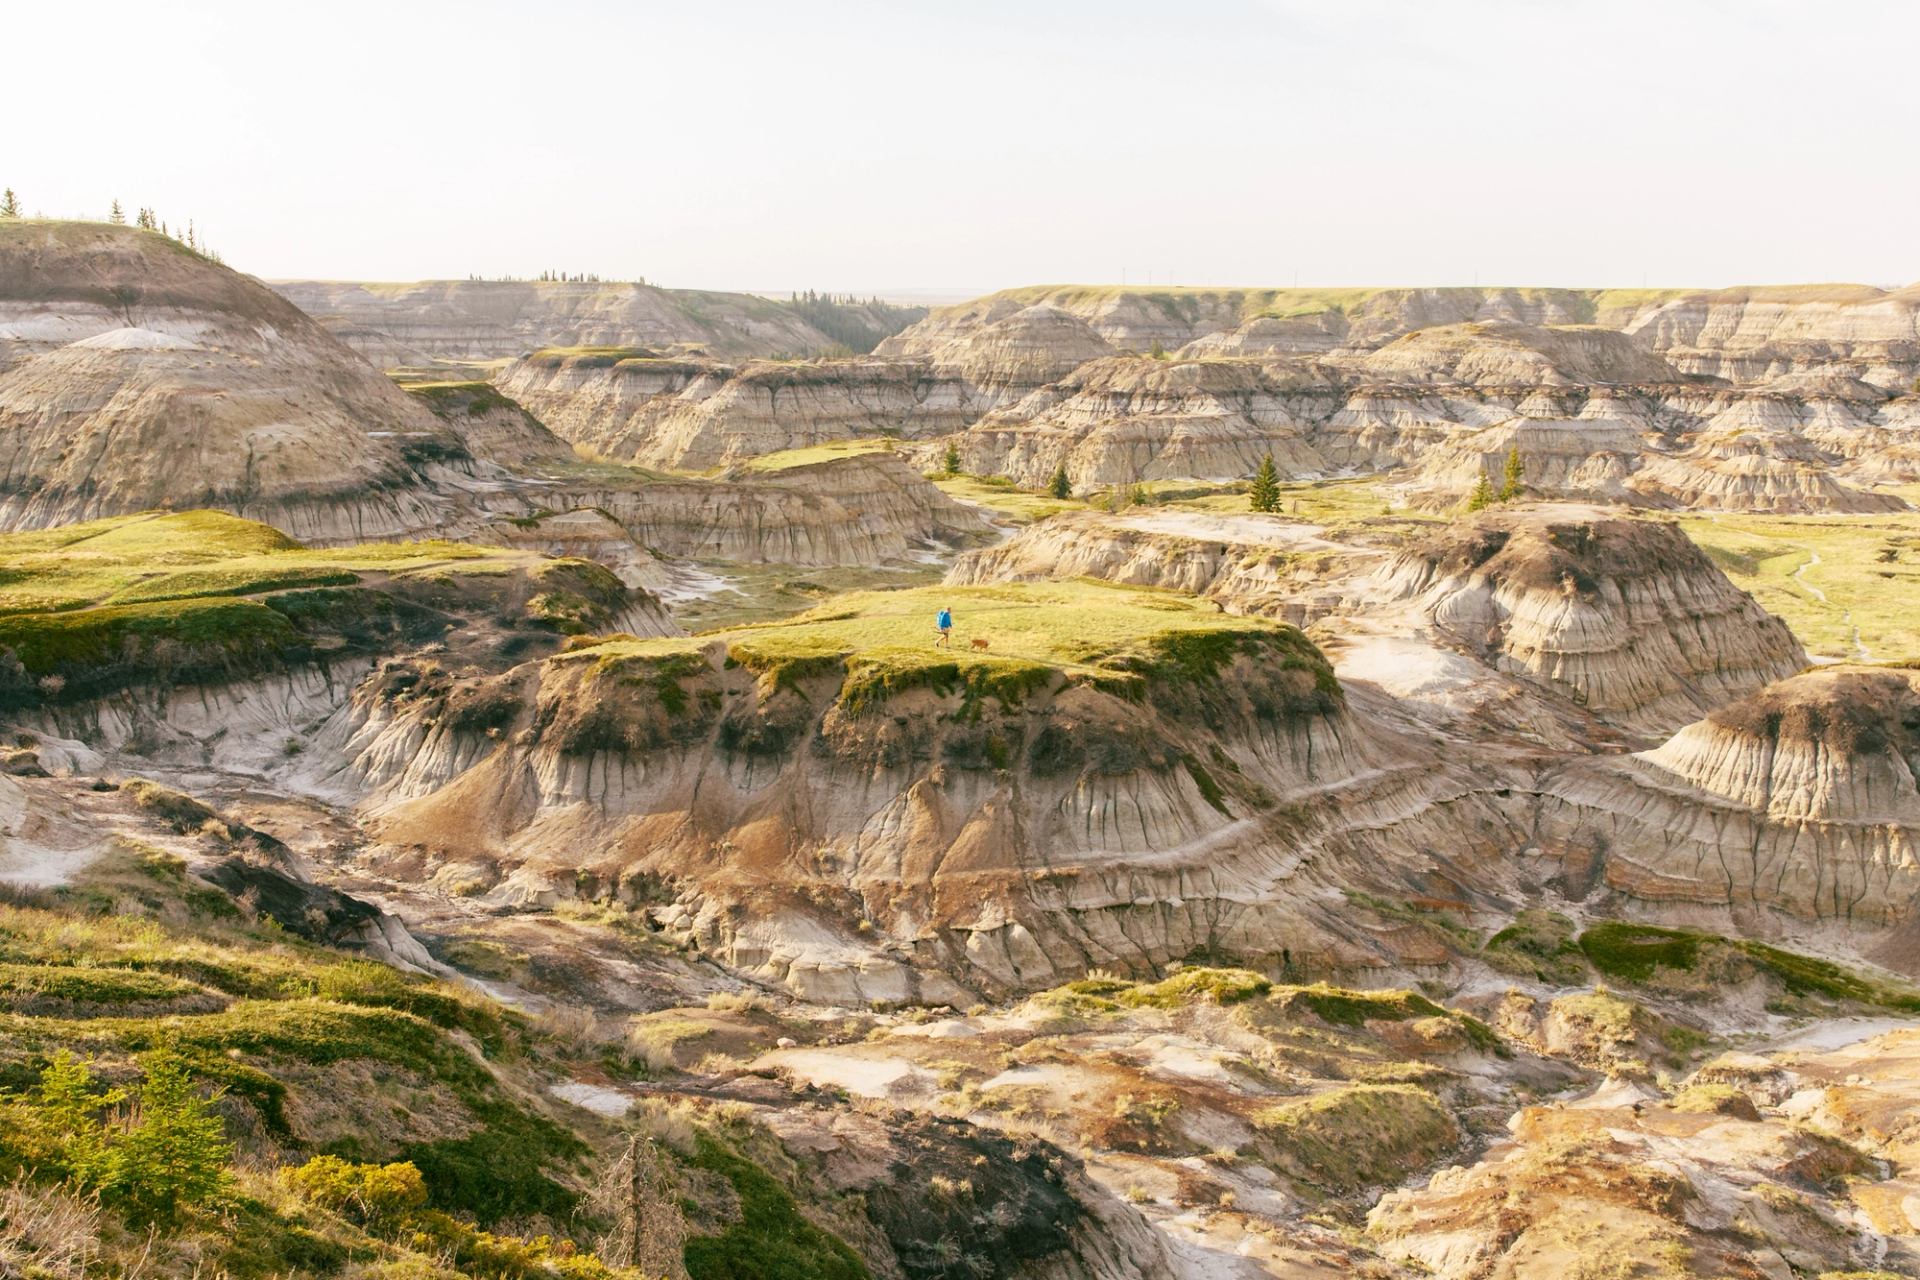
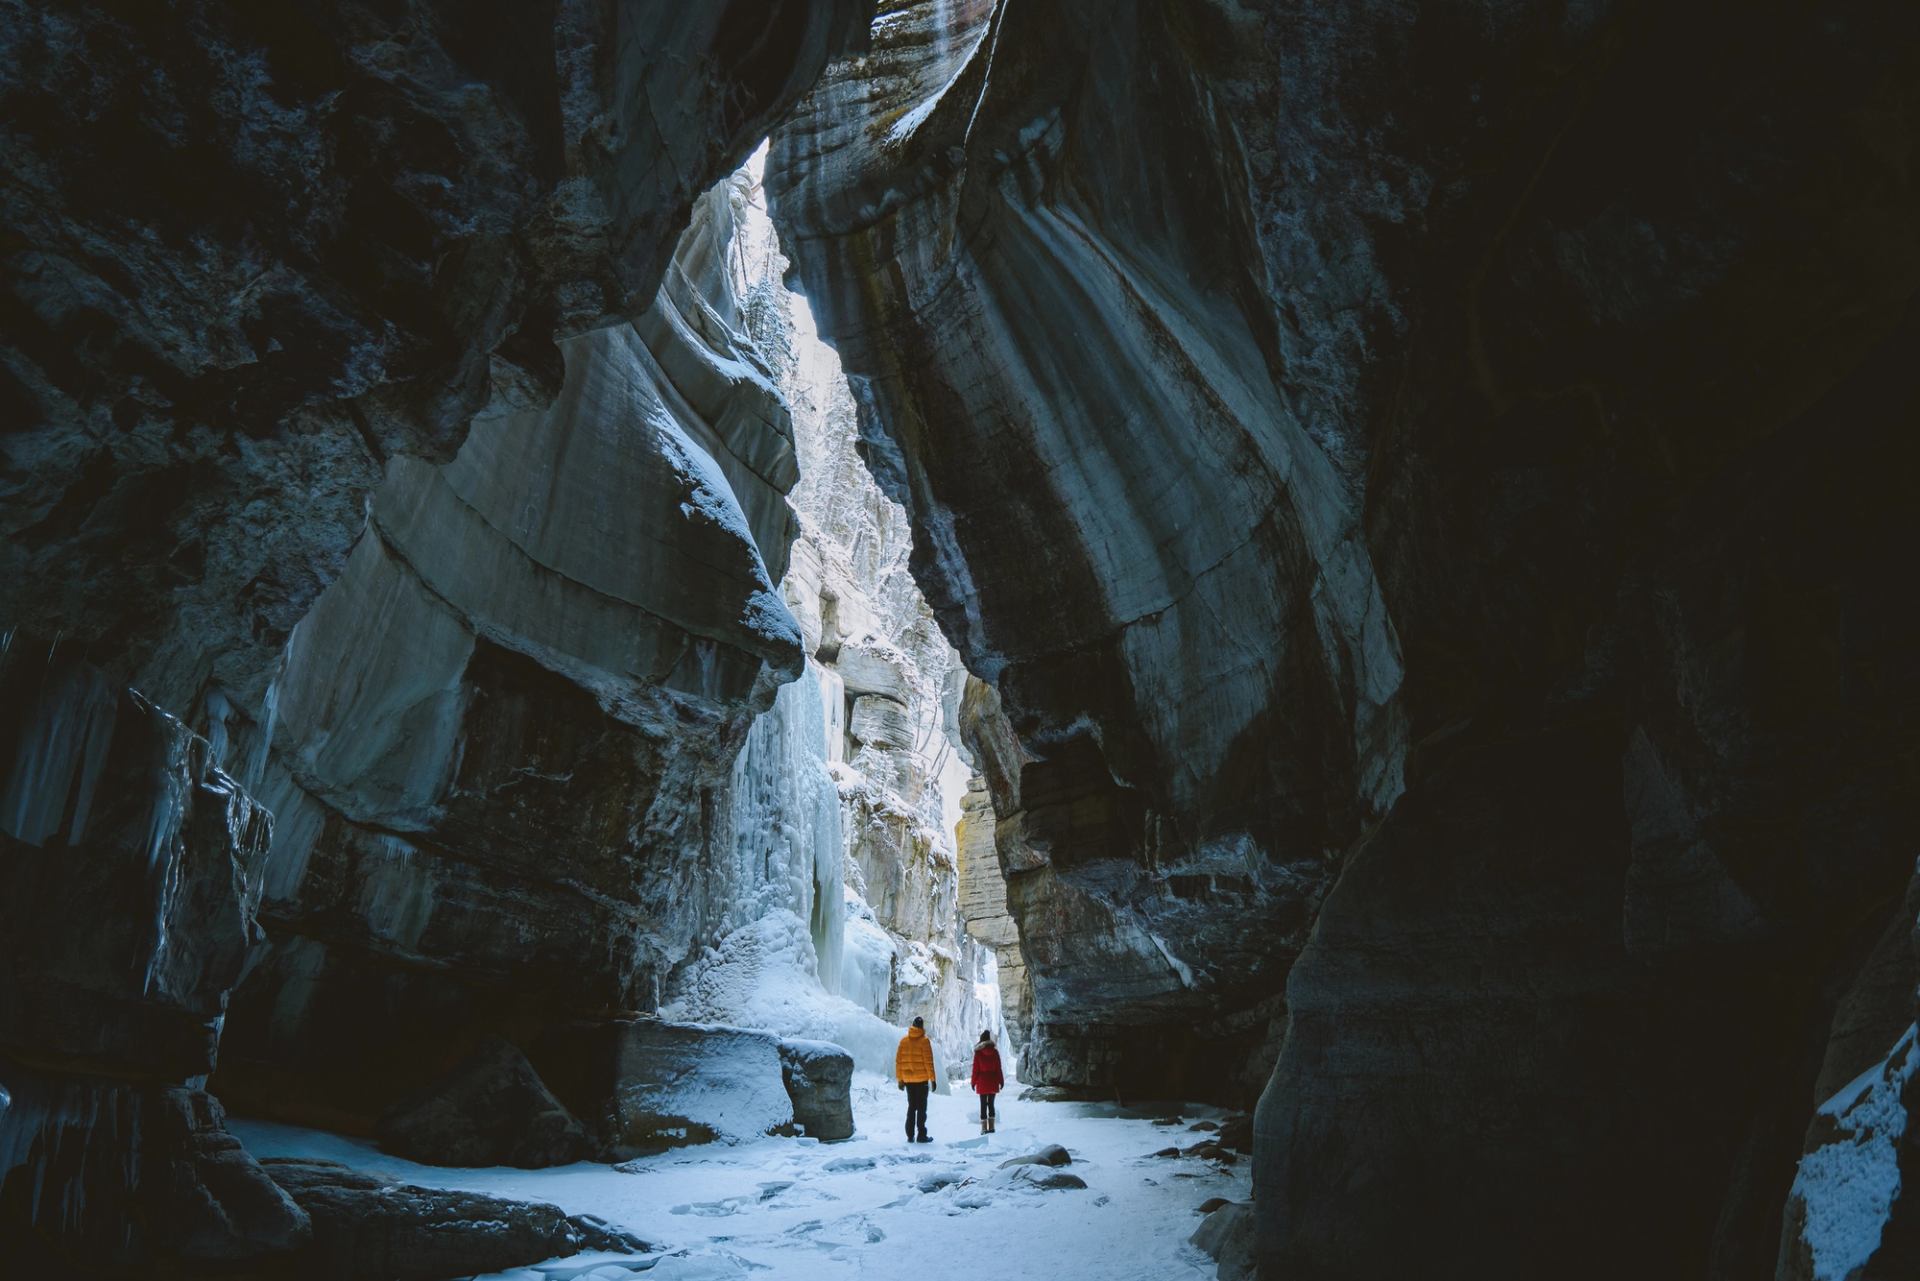
Natural attractions (e.g. scenic viewpoints, mountains, waterfalls) | 924K |
Fine dining | 829K |
Historical, archaeological or world heritage sites | 818K |
Northern lights | 806K |
Nature parks | 736K |
What's the purpose of their visit? |
|---|

Sources
Estimated spend data is derived from Destination Canada's Lodging Aligned Spend Reporting (LASR) (April 2026). Use, distribution, or republication of these estimates requires Destination Canada's written consent.
Global Traveller Research Program, 2024, 2025.
Oxford Economics.
Bank of Canada.
DIIO, Cirium.
Mobile Insights, Rove.