Total expenditure in Alberta

$35 Million (2023)

$42 Million (Jan-Sept 2024)

Passport holders

30 Million (2023)

Average length of stay in Alberta

3 days (2023)

Potential market size

2.5 Million (2024)

Overview

South Korea’s economy is projected to experience both growth and stabilization. GDP per capita fluctuates, dipping in 2025 before recovering in 2026. The exchange rate slightly weakens, impacting trade dynamics. Unemployment remains low, showing labor market resilience. Inflation slows, with annual rates declining from 3.6% in 2023 to 1.8% in 2026. Overall, 2025 marks a surge in economic activity before a return to steady growth.

On this page:

Competitor Comparison
Air Travel
Economic Indicators
Traveller Characteristics

Man standing beside his snowmobile

Competitor Comparison

January - September 2024

Indicator

Quebec

Ontario

Alberta

BC

Canada

Expenditure

$19 Million

$90 Million

$42 Million

$108 Million

$0.3 Billion

Share of total national expenditure

7%

35%

16%

42%

-

2023

Indicator

Quebec

Ontario

Alberta

BC

Canada

Expenditure

$28 Million

$108 Million

$35 Million

$110 Million

$0.3 Billion

Share of total national expenditure

10%

37%

12%

37%

-

Air Travel

Economic Indicators

Indicator

2023

2024 Estimated

2025 Forecasted

2026 Forecasted

GDP - per capita (US$)

$35,538

$36,172

$34,199

$36,604

GDP - YoY Growth Rate

2.2%

2.8%

10.9%

-

Exchange Rate (CAD/KRW) (annual average)

$0.001

0.001005%

N/A

N/A

Unemployment Rate (annual average)

2.7%

2.6%

2.6%

2.7%

Annual inflation

3.6%

2.3%

2.0%

1.8%

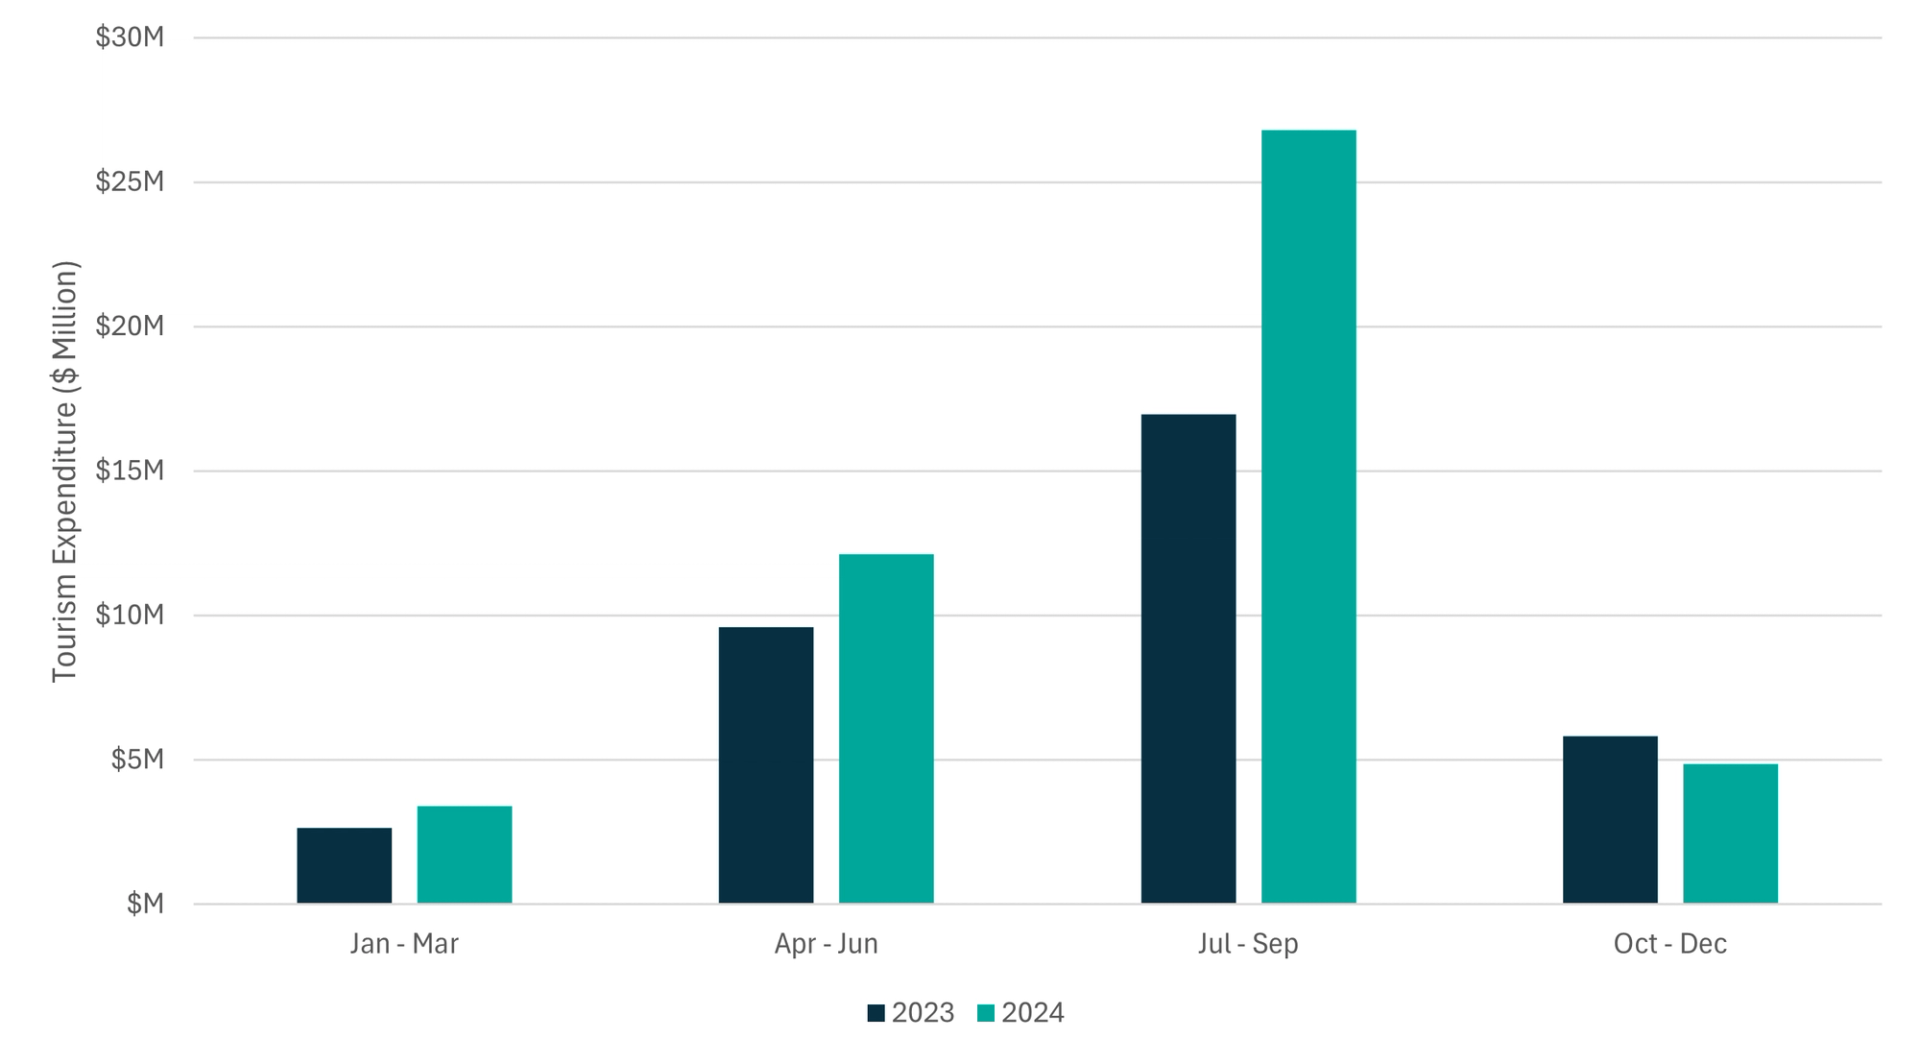
Quarterly traveller spend

Traveller Characteristics

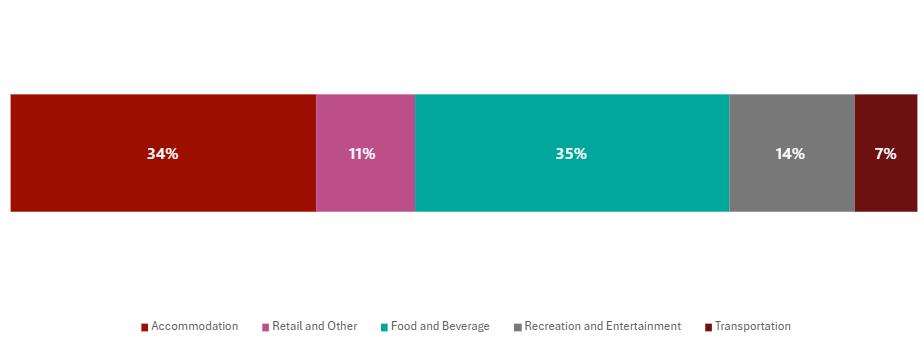
Breakdown of traveller spending

Top barriers to travel

Too far / Too long

48%

Cost

44%

Destinations and attractions too far apart

20%

Extreme Weather Conditions

19%

Poor value for money

18%

Top 5 trip anchors

Market size

Nature walks

957,380

Natural attractions (e.g. scenic viewpoints, mountains, waterfalls)

950,718

Trying local food and drink

930,732

Nature parks

667,694

Local markets (e.g. public markets, farmers market, night markets)

660,173

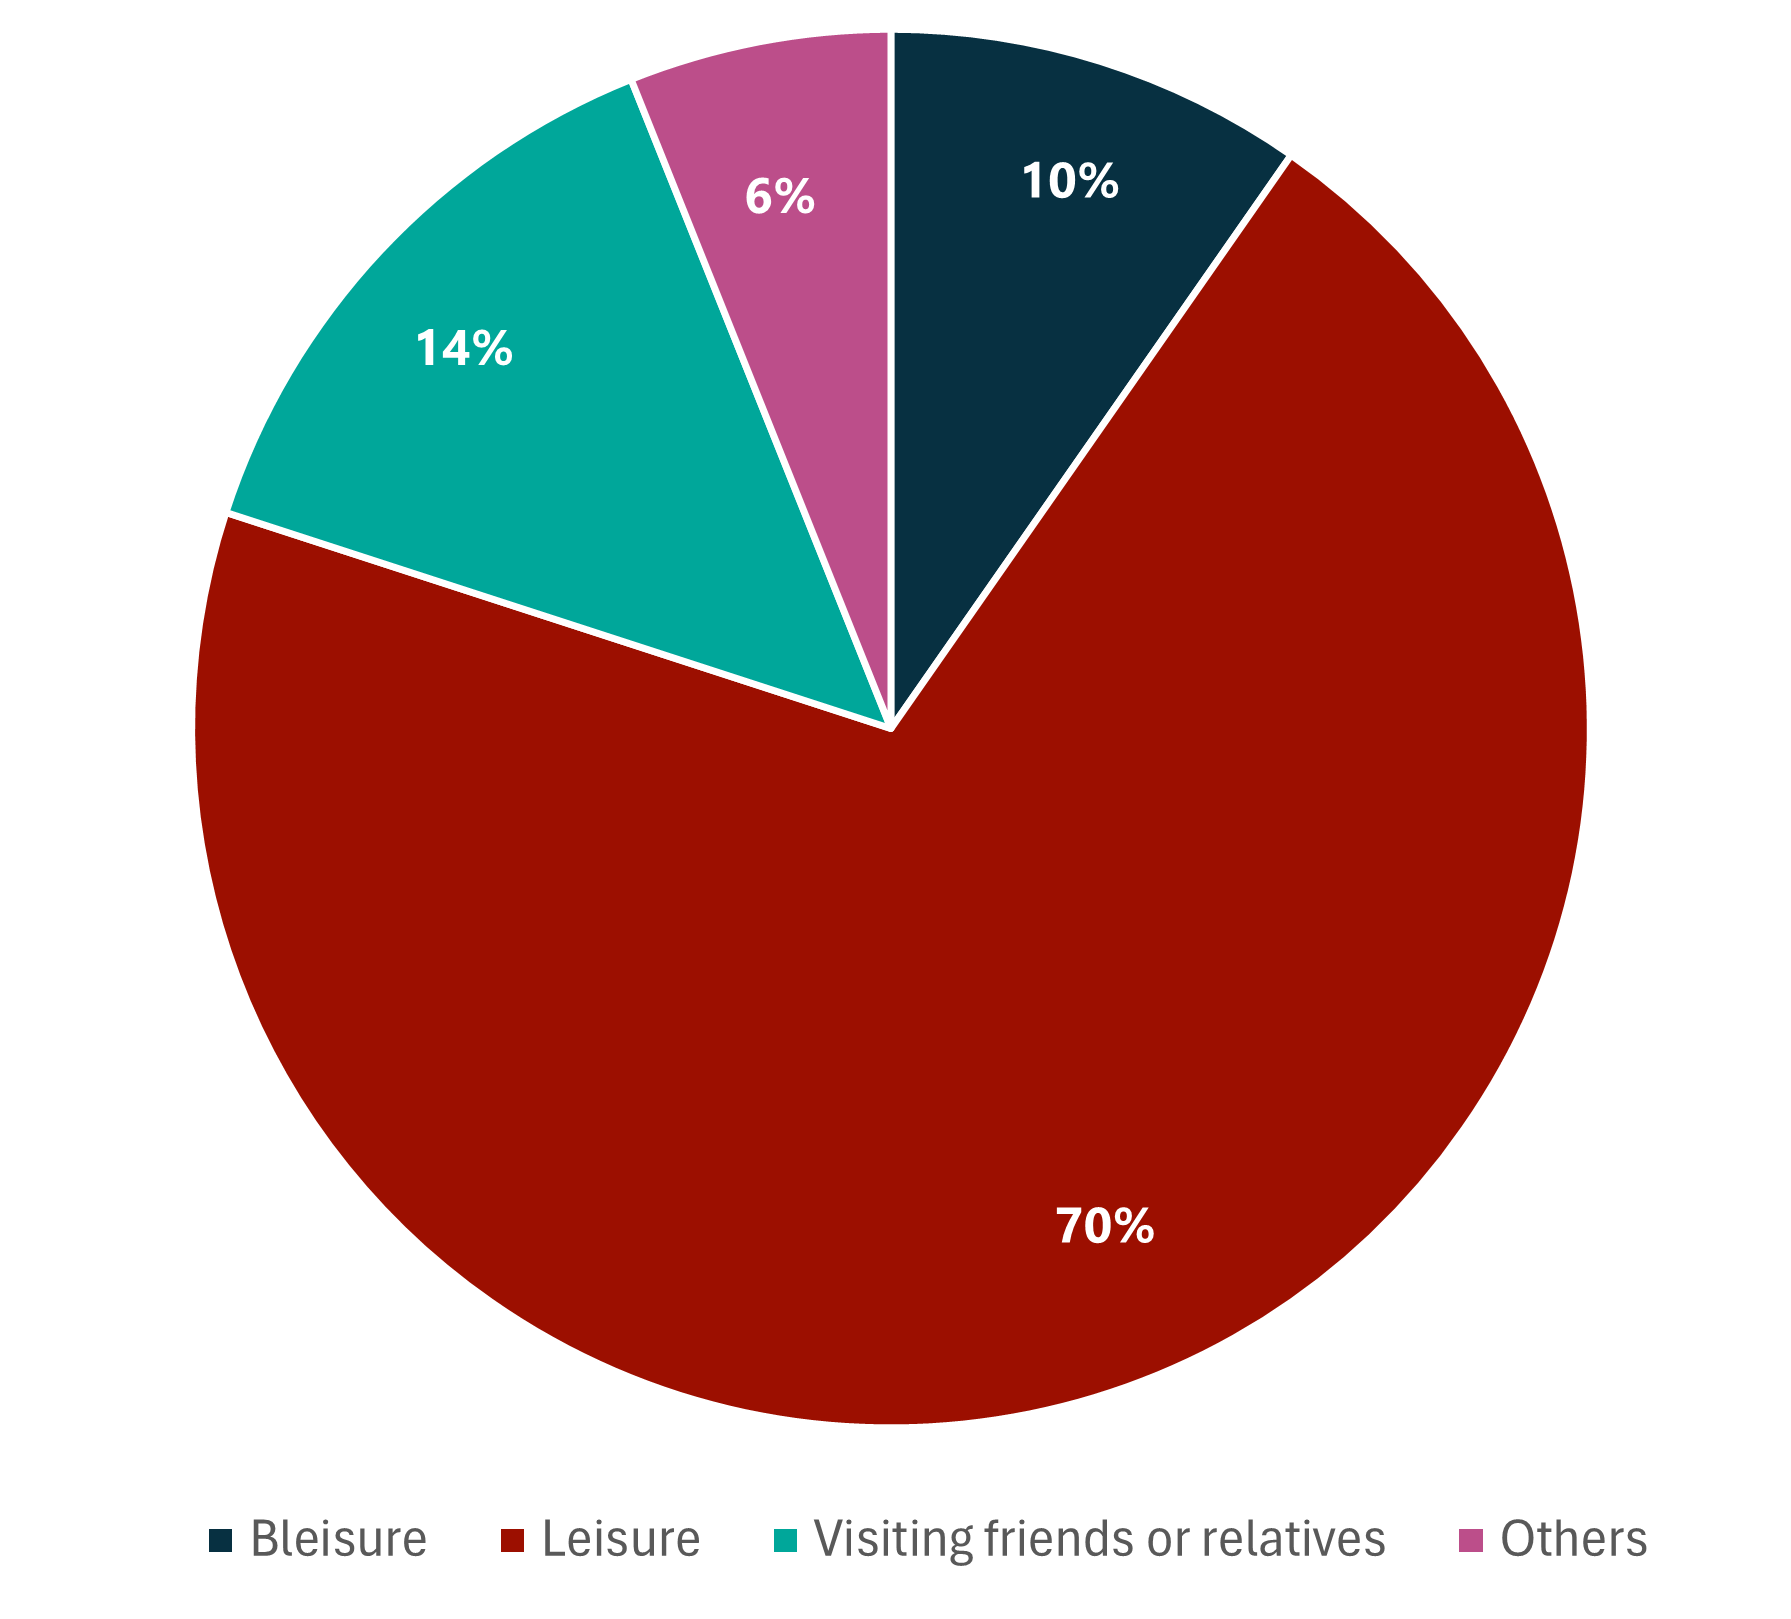
Purpose of visit

Sources

Statistics Canada, Visitor Travel Survey Data 2024/2023
Global Tourism Research Program (GTRP), Destination Canada
Lodging Aligned Spend Reporting (LASR), Destination Canada, 2024
Oxford Economics
DIIO, Cirium
Bank of Canada
UNWTO: UN Tourism Barometer
Mobile Insights, Near