Competitor Comparison
2024
Indicator | Quebec | Ontario | Alberta | BC | Canada |
|---|---|---|---|---|---|
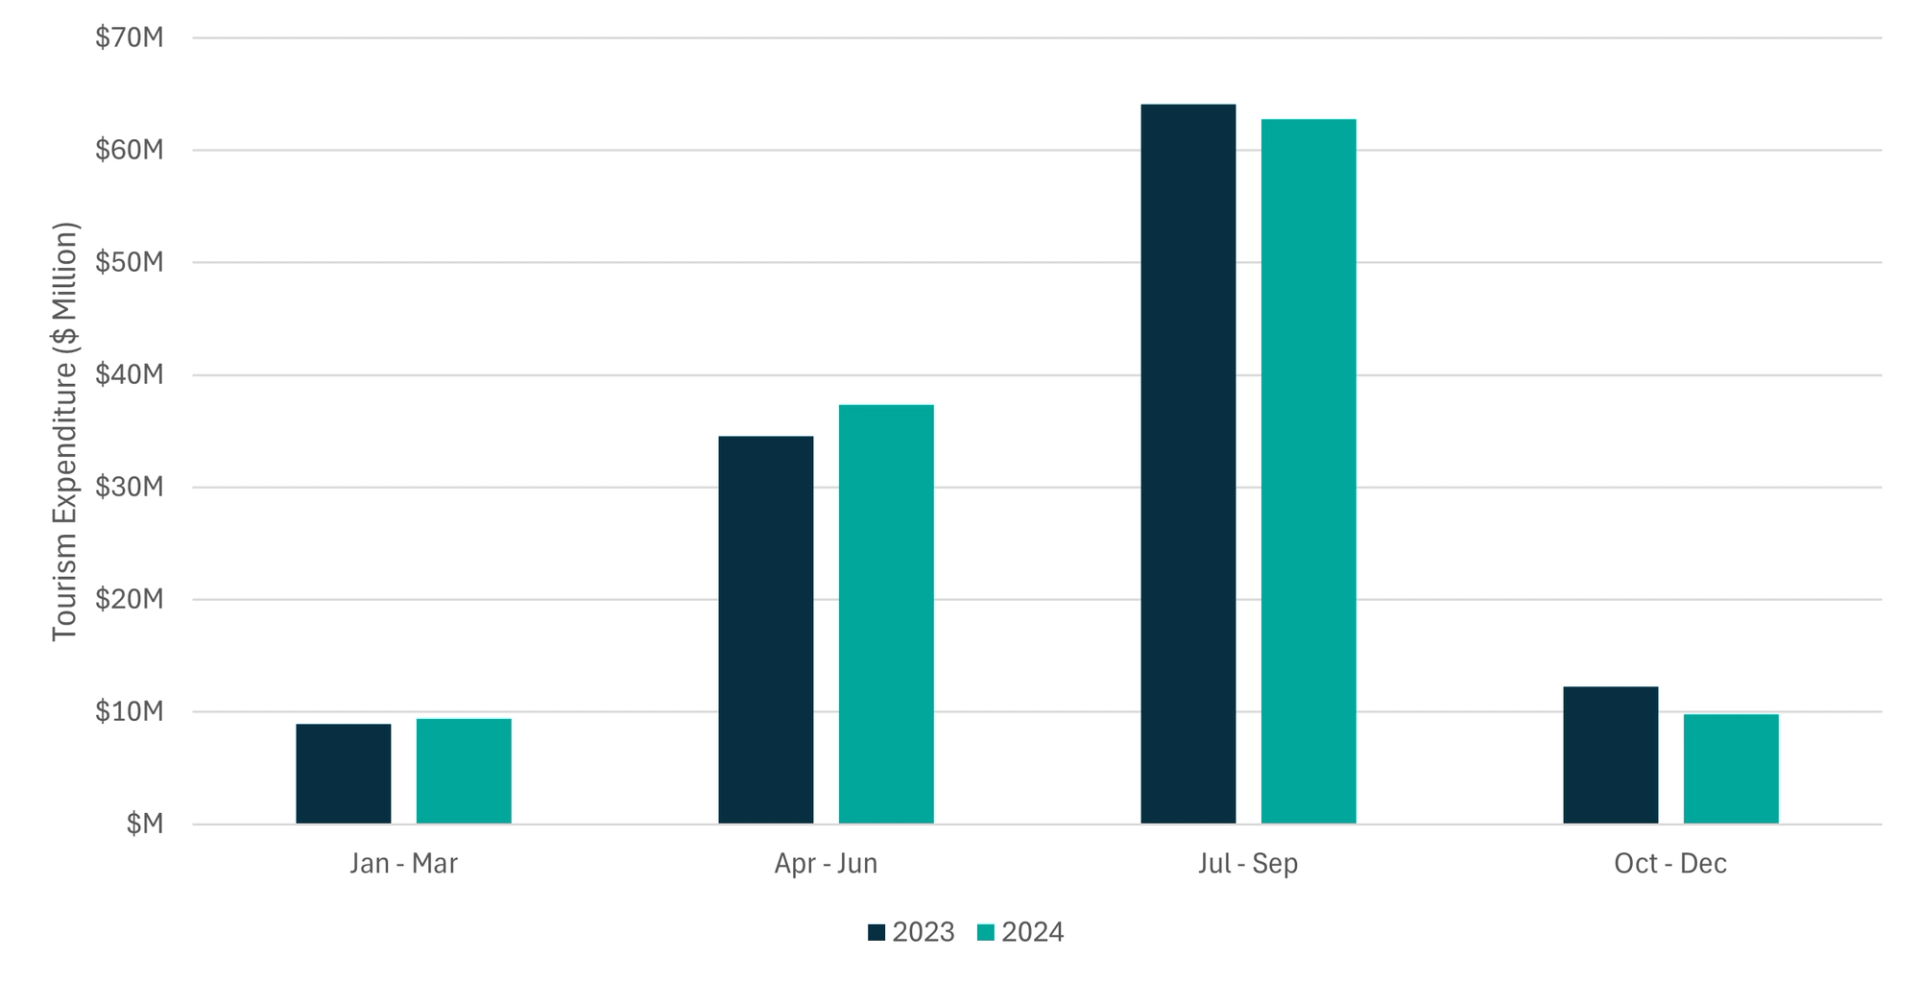
Expenditure | $91 Million | $191 Million | $119 Million | $363 Million | $0.9 Billion |
Share of total national expenditure (2023) | 11% | 21% | 15% | 43% | - |
2023
Indicator | Quebec | Ontario | Alberta | BC | Canada |
|---|---|---|---|---|---|
Expenditure | $100M | $210M | $120M | $339M | $0.8B |
Share of total national expenditure | 12% | 25% | 14% | 40% | - |


