You are using an outdated browser. Please upgrade your browser to improve your experience and security.

Skip to main content

$184 Million

Total expenditure in Alberta (2022)

51 Million

Number of passport in circulation (2022)

2.3 Million

Potential visitors to Alberta (2022)

3 days

Average length of stay in Alberta (2023)

Overview

Outbound travel from United Kingdom continues to recover – despite economic headwinds, inflation is trending downwards and stronger GDP growth is in the forecast for 2024. Oxford Economics forecasts outbound travel to be 108% of 2019 levels in 2023 and to peak in 2023.

On this page:

Competitor Comparison
Air Travel
Economic Indicators
Traveller Characteristics

A group dining at Buffalo Mountain Lodge

Competitor Comparison

Indicator Quebec Ontario Alberta BC Canada
Expenditure (2022) $112 Million $250 Million $184 Million $316 Million $934 Million
Share of total national expenditure (2022) 12% 27% 20% 34% -
Visitation (2019) 154 Thousand 434 Thousand 187 Thousand 297 Thousand 1.2 Million
Share of total national visitation (2019) 13% 36% 16% 25% -
Expenditure (2019) $123 Million $447 Million $200 Million $434 Million $1.3 Billion
Share of total national expenditure (2019) 10% 35% 15% 34% -
Average spend (2019) $799 $1,031 $1,070 $1,463 $1,076

*Visitation and average spend estimates are not available for the United Kingdom for the 2022 calendar year. 

Air Travel

Economic Indicators

Indicator 2022 2023 2024 Forecast
GDP - per capita $45,833 $49,184 $49,751
GDP - YoY Growth Rate -2.1% 7.3% 1.2%
Exchange Rate (CAD/GBP) (annual average) $1.16 $1.68 N/A
Unemployment Rate (annual average) 3.7% 4.2% 4.6%
Inflation Rate (annual average) 9.1% 7.4% 3.1%

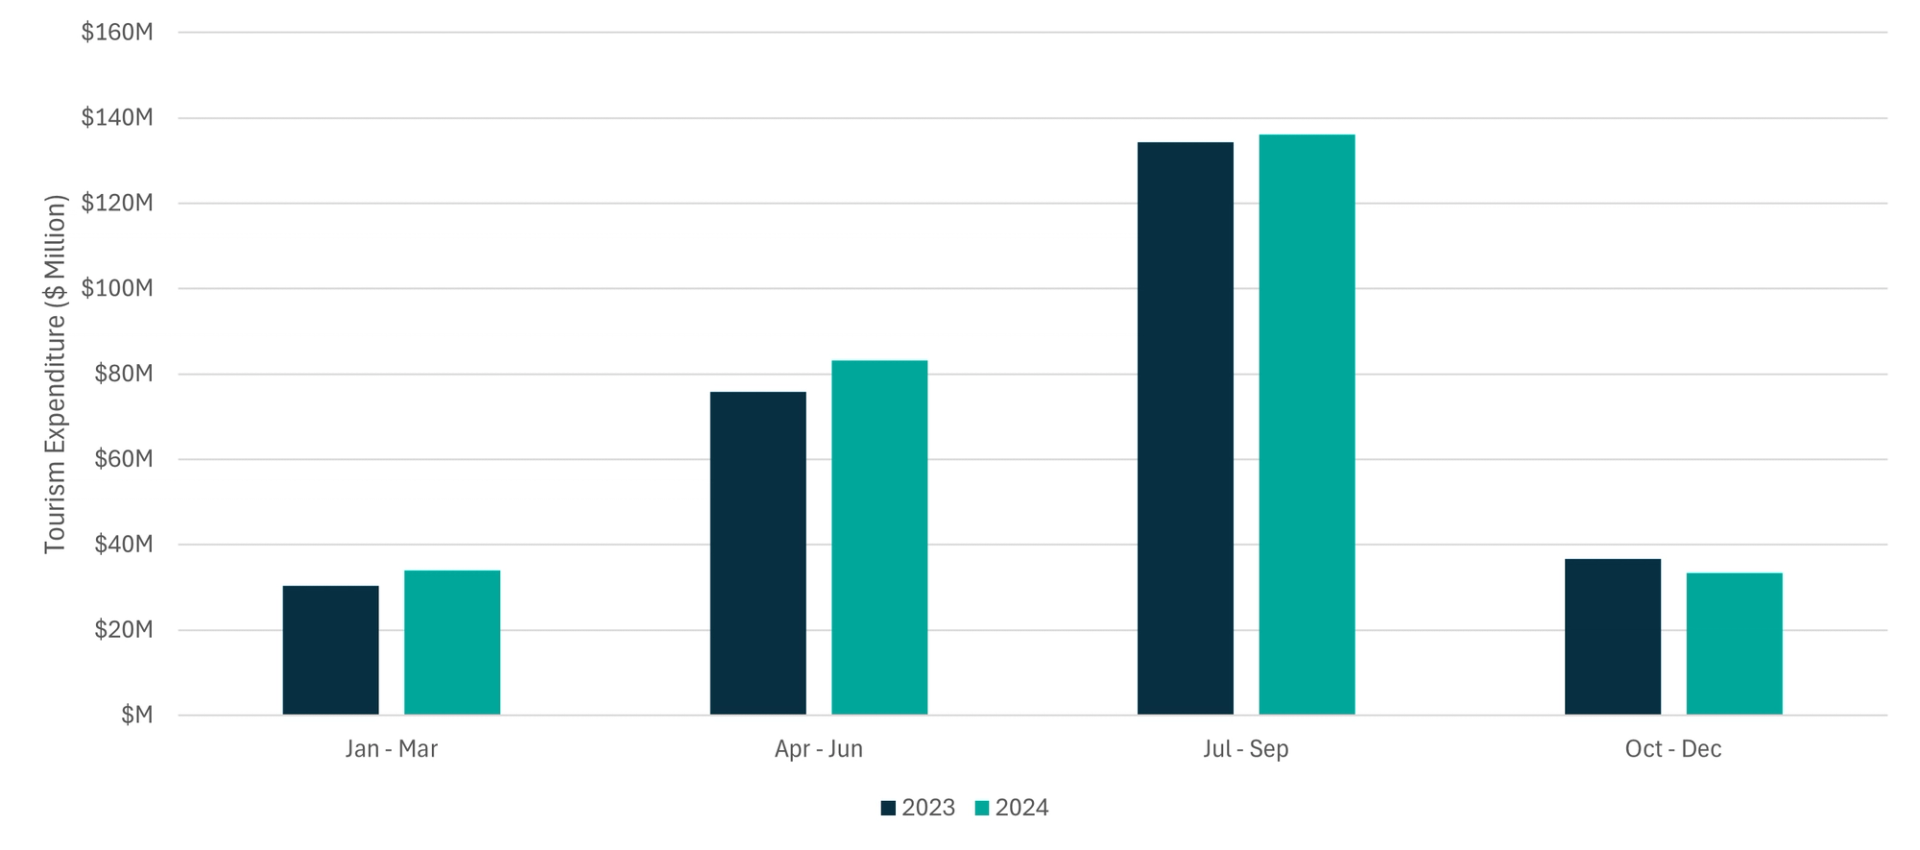
Quarterly traveller spend

Traveller Characteristics

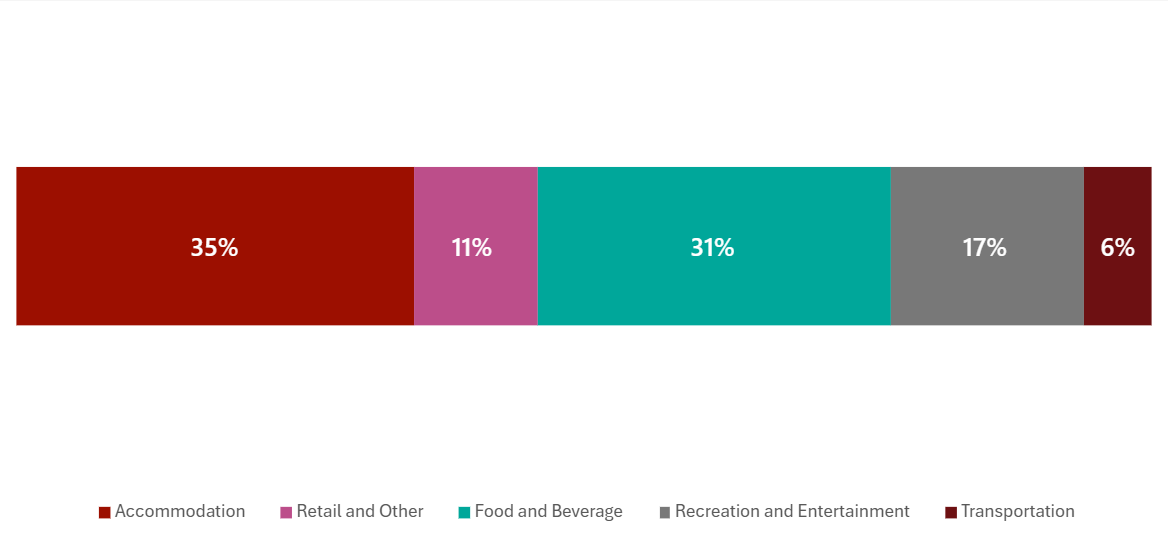
Breakdown of traveller spend

Top barriers to travel
Economic environment 69%
Higher transport and accommodation costs 55%
Extreme weather events 28%
Geopolitical conflicts 24%
Staff shortages 22%
Other  14%
Top 5 trip anchors
Nature Attractions 64%
Trying local food and drink 59%
Hiking or walking in the nature 56%
Viewing wildlife 52%
Nature parks 52%
Accommodation booking channel
Online through a travel agent/tour operator 53%
Through an online booking engine 47%
In-person through a travel agent/tour operator 26%
Directly through lodging/accommodation establishment 23%
Through accommodation sharing services website 16%
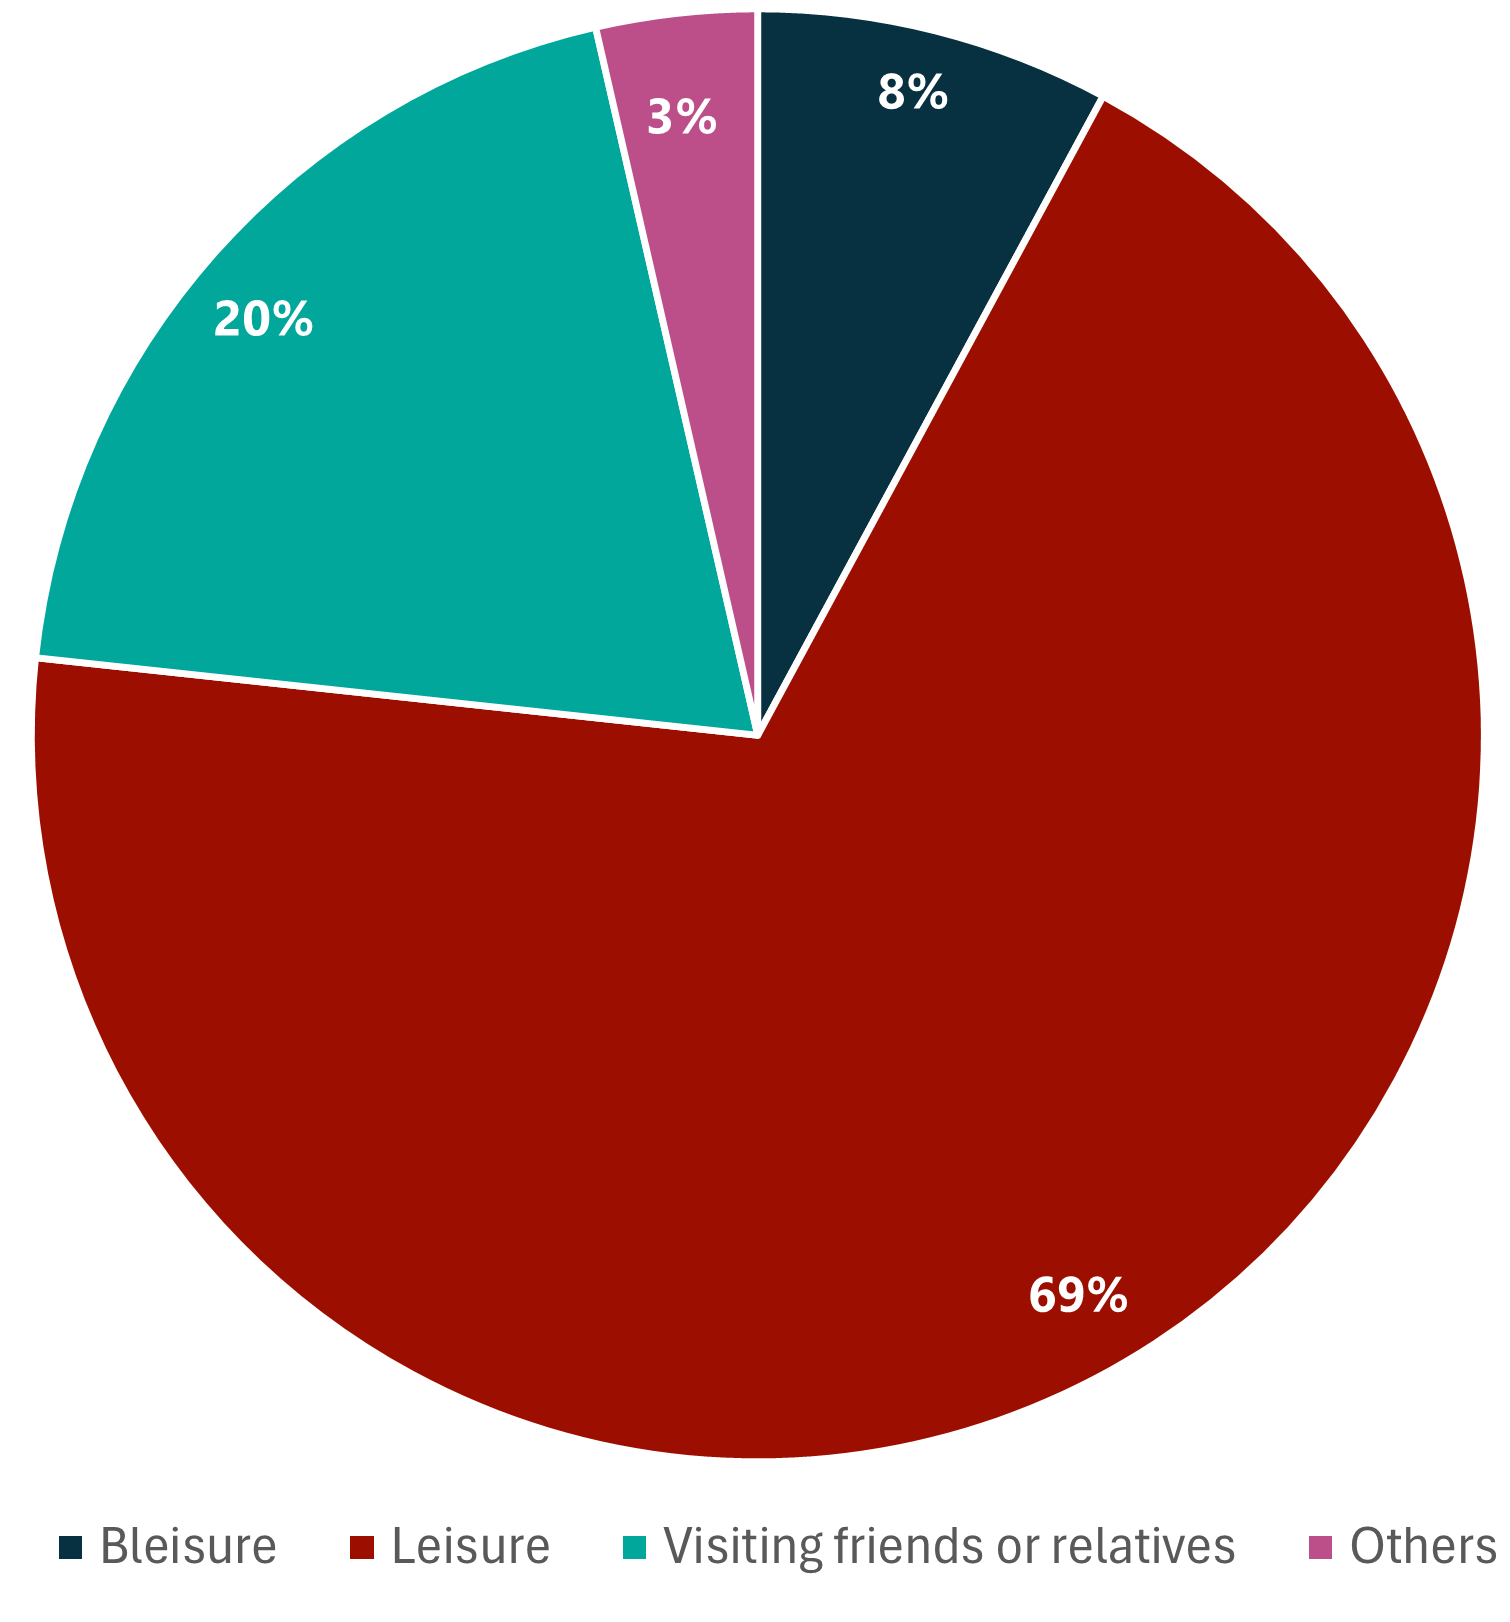
Purpose of visit