Total expenditure in Alberta

$1.6 Billion (2023)

$1.8 Billion (Jan-Sept 2024)

Passport holders

169.9 Million (2024)

Potential market size

14.4 Million (2024)

Average length of stay in Alberta

3 days (2023)

Overview

The U.S. GDP growth forecast was slightly increased to 1.3% in 2025 and 1.7% in 2026, though the economy is expected to grow below potential due to tariffs, supply-chain stress, and policy uncertainty, with elevated recession risks through early next year. The unemployment rate is projected to average 4.7% in Q4 2025, with risks suggesting a smaller rise than anticipated, influenced by labor force participation trends.

On this page:

Competitor Comparison
Air Travel
Economic Indicators
Traveller Characteristics

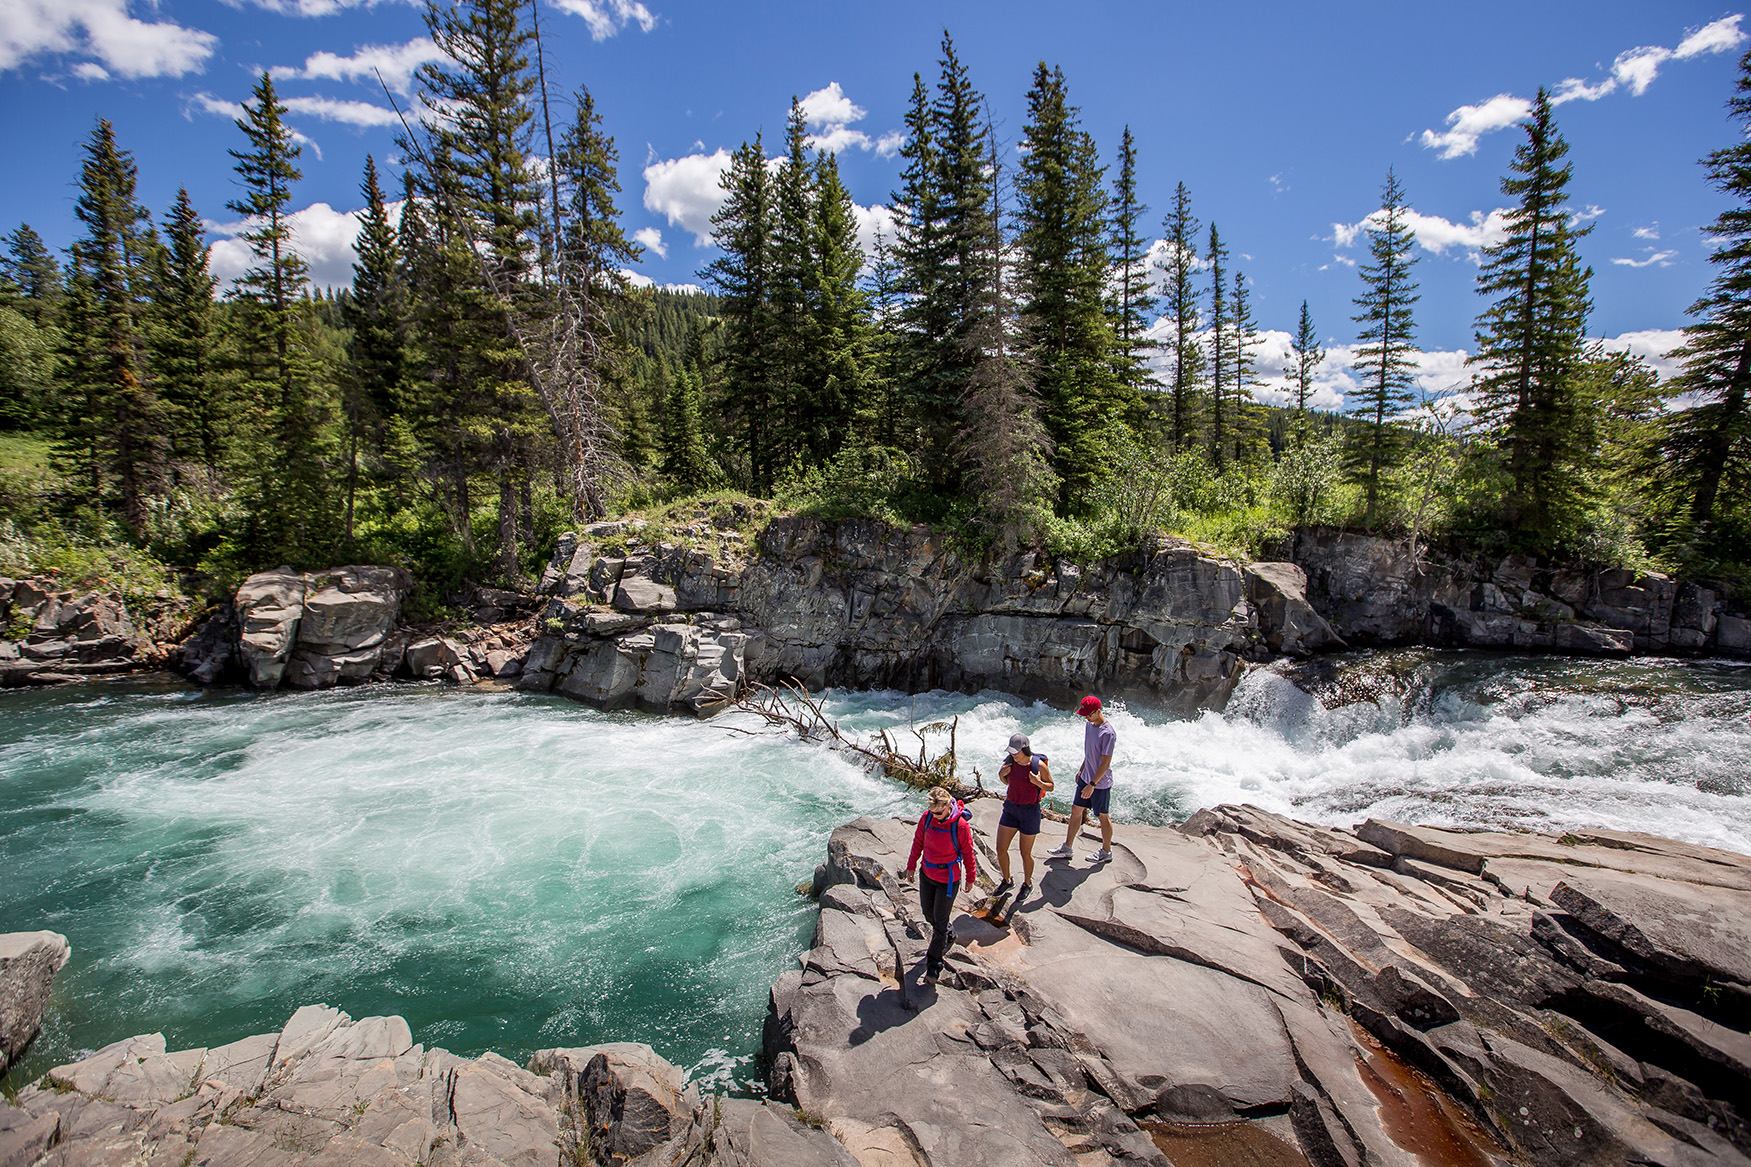
Guided hike at Castle Falls in Castle Provincial Park with Uplift Adventures.

Competitor Comparison

January-September 2024

Indicator

Quebec

Ontario

Alberta

BC

Canada

Visitation

2 Million

9 Million

1.2 Million

5.6 Million

20 Million

Expenditure

$1.7 Billion

$3.8 Billion

$1.8 Billion

$3.9 Billion

$12.4 Billion

Share of total national expenditure

14%

31%

14%

32%

-

2023

Indicator

Quebec

Ontario

Alberta

BC

Canada

Visitation

3 Million

10 Million

1.3 Million

6.3 Million

23 Million

Expenditure

$1.9 Billion

$4.5 Billion

$1.6 Billion

$3.7 Billion

$12.9 Billion

Share of total national expenditure

15%

35%

12%

29%

-

Average spend

$861

$658

$1,356

$953

-

Air Travel

Economic Indicators

Indicator

2023

2024 Estimated

2025 Forecasted

2026 Forecasted

GDP - per capita (US$)

$82,819

$86,730

$89,953

$92,486

GDP - YoY Growth Rate

2.9%

2.8%

1.3%

1.7%

Exchange Rate (CAD/USD) (annual average)

$1.35

$1.37

N/A

N/A

Unemployment Rate (annual average)

3.6%

4.1%

4.3%

4%

Annual inflation

4.1%

3%

3.6%

2.4%

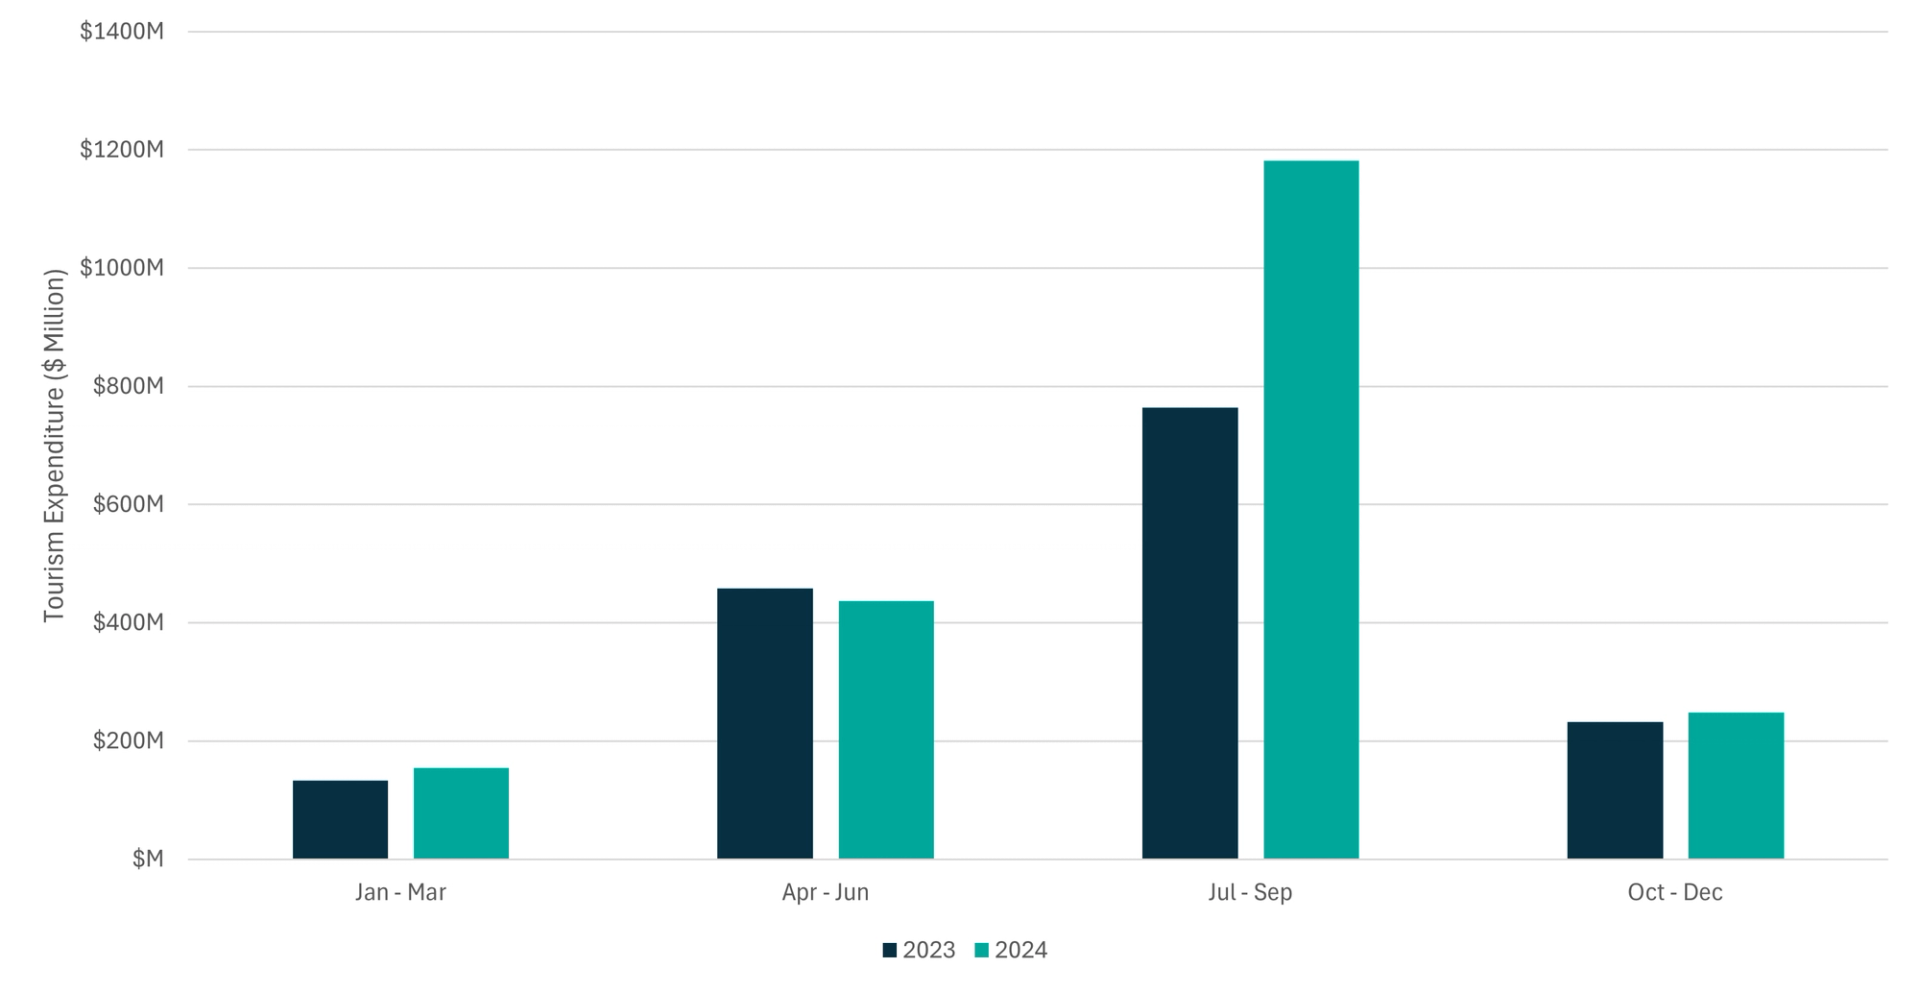
Quarterly traveller spend

Traveller Characteristics

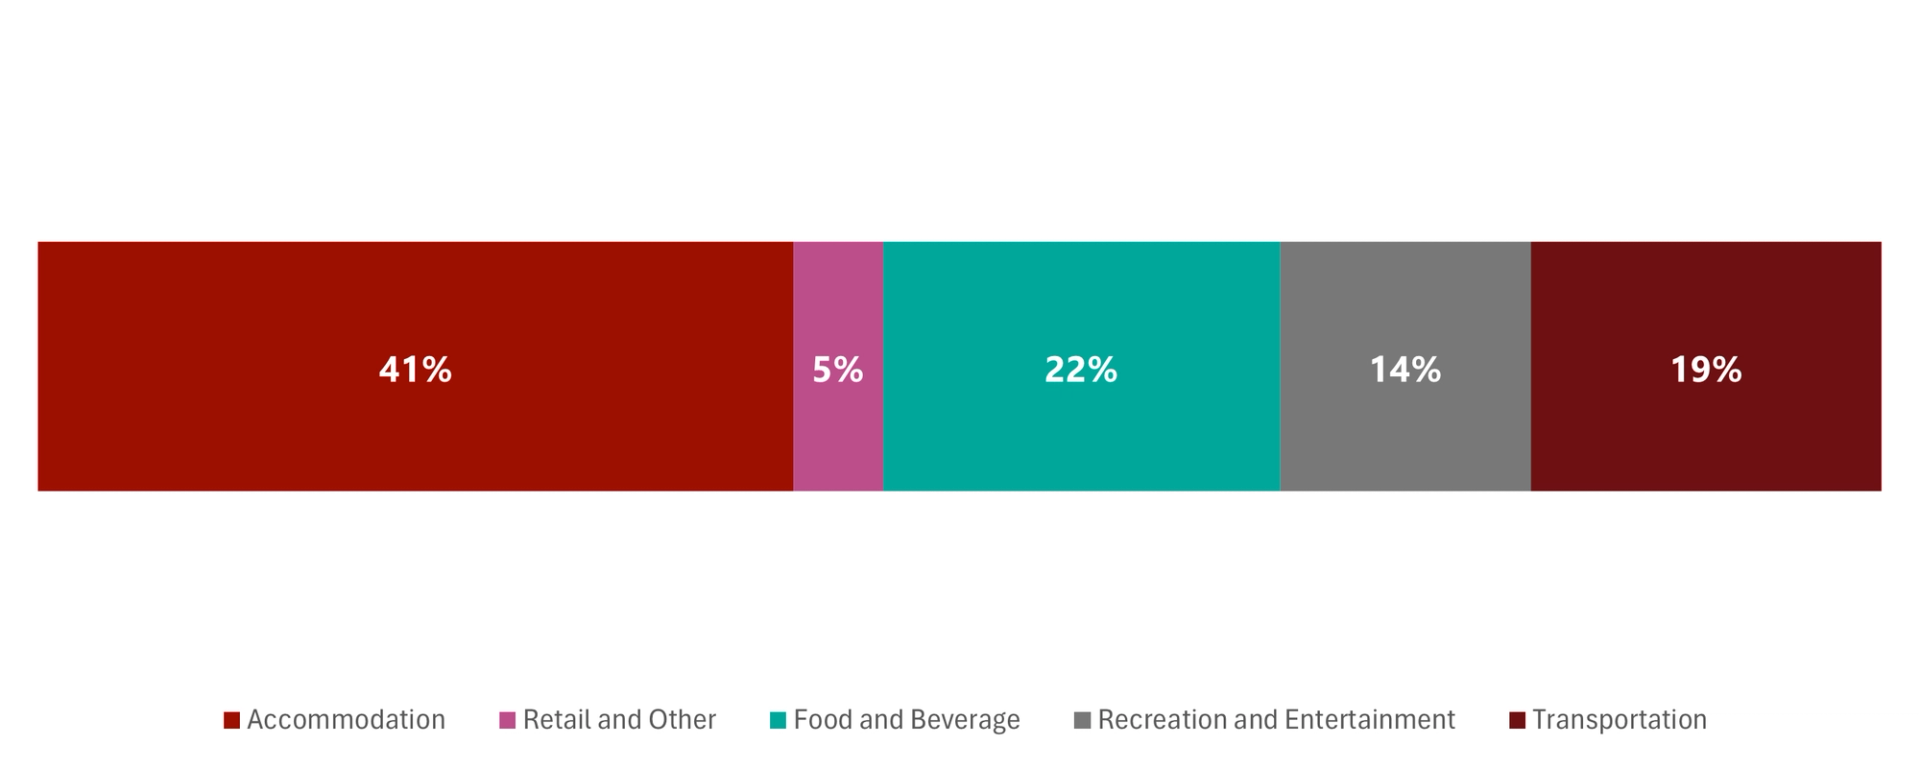
Breakdown of traveller spending

Top barriers to travel

Cost

35%

Extreme weather conditions

19%

Poor weather

18%

Unfavorable conditions

18%

Not enough time to take a vacation

18%

Top 5 trip anchors

Market Size

Natural attractions (e.g. scenic viewpoints, mountains, waterfalls)

6,613,375

Historical, archaeological or world heritage sites

5,135,149

Northern lights

4,857,262

Autumn colours

4,125,549

Nature walks

3,977,562

Preferred marketing channel

Email

35%

Websites found via a search engine

34%

Facebook

30%

Online content (articles and blogs)

24%

Instagram

20%

Streaming video services (YouTube, Hulu, etc.)

16%

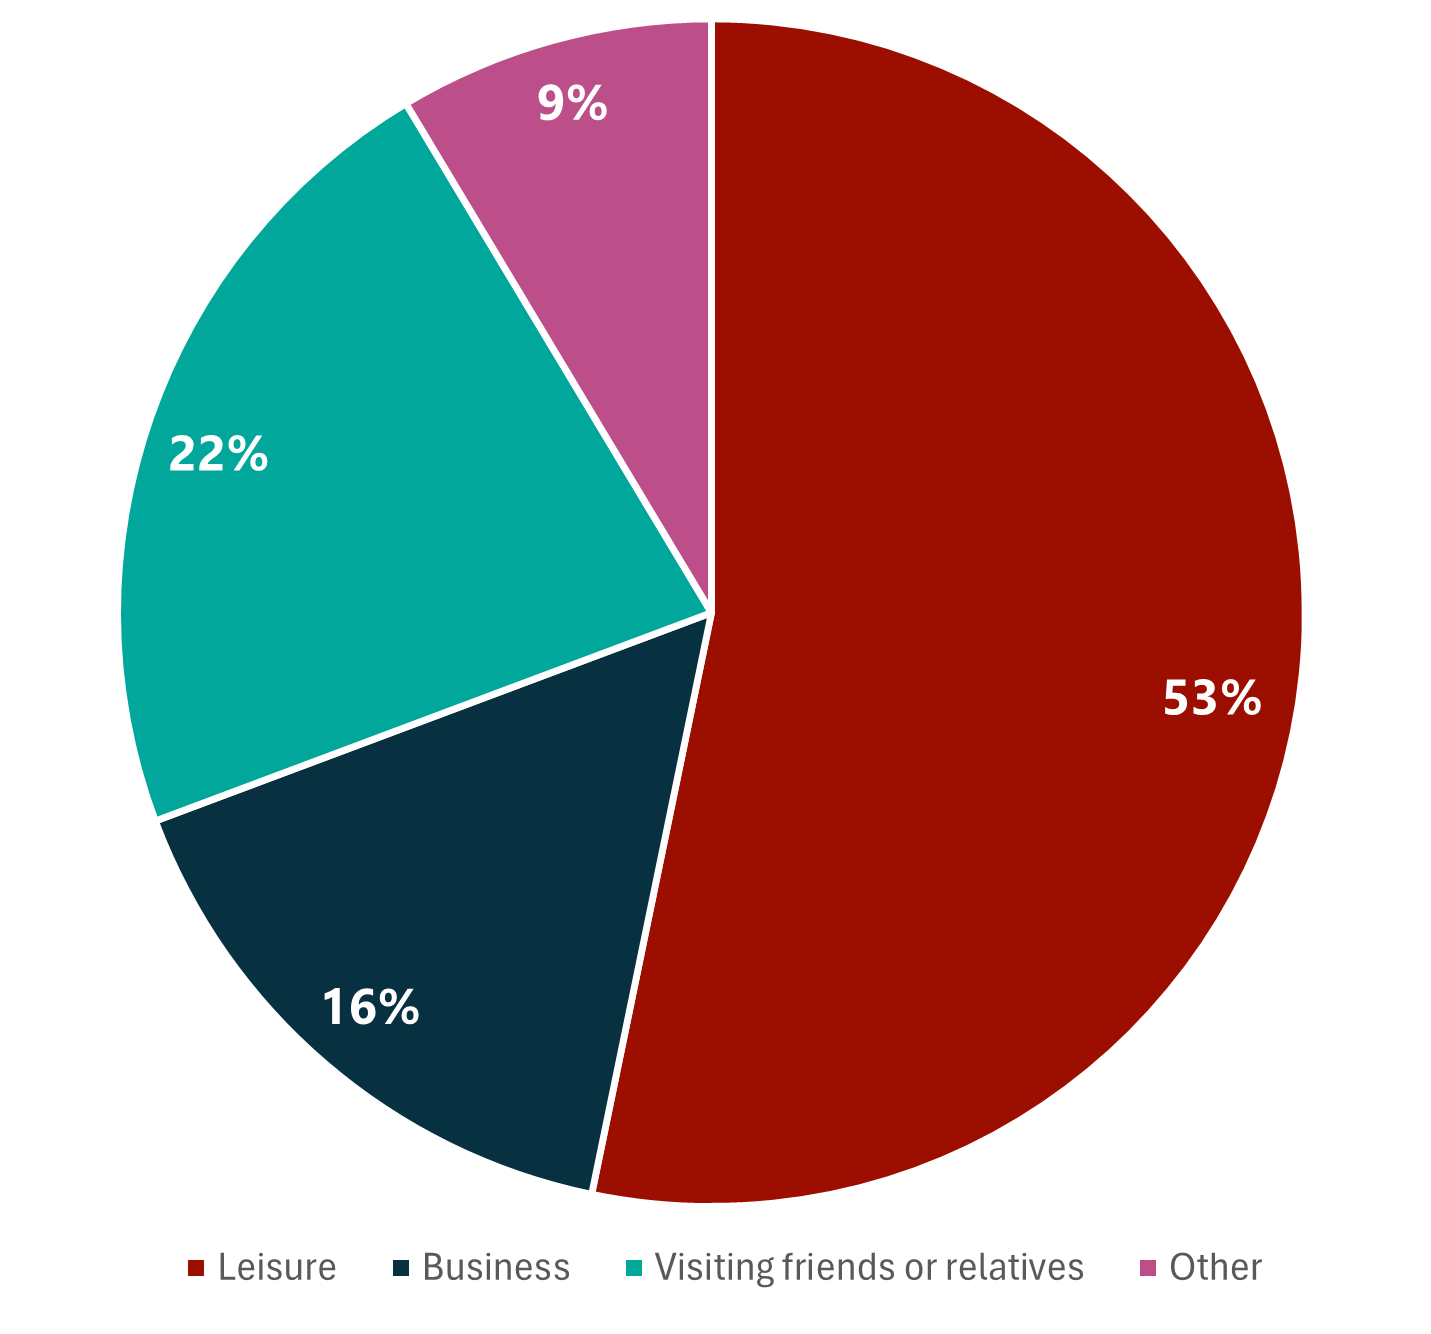
Purpose of visit

Sources

Statistics Canada, Visitor Travel Survey Data 2024/2023
Global Tourism Research Program (GTRP), Destination Canada
Lodging Aligned Spend Reporting (LASR), Destination Canada, 2024
Oxford Economics
DIIO, Cirium
Bank of Canada
UNWTO: UN Tourism Barometer
Mobile Insights, Near