You are using an outdated browser. Please upgrade your browser to improve your experience and security.

$45 Million

Total Expenditure in Alberta (2019)

43 Thousand

Total Person-Visits to Alberta (2019)

Overview

Outbound travel fell to 59% below 2019 levels in 2021 due to worldwide border closures brought in to curtail rising infection rates. Recovery is expected to get underway throughout 2023, with vaccine roll- outs allowing for the easing of restrictions, with Netherlands outbound travel set to improve to 25% below 2019 levels. High inflation and weakening economic growth is likely to dampen the near-term travel recovery however Oxford Economics anticipates outbound travel will return to 2019 levels by 2025.

On this page

Competitor Comparison
Air Travel
Economic Indicators
Traveller Characteristics

Horseback riding at Boundary Ranch

Competitor Comparison

Indicator Quebec Ontario Alberta BC Canada
Visitation (2019) 22 Thousand 61 Thousand 43 Thousand 47 Thousand 187 Thousand
Share of total national visitation (2019) 12% 33% 23% 25% -
Expenditure (2019) $17 Million $58 Million $45 Million $81 Million $212 Million
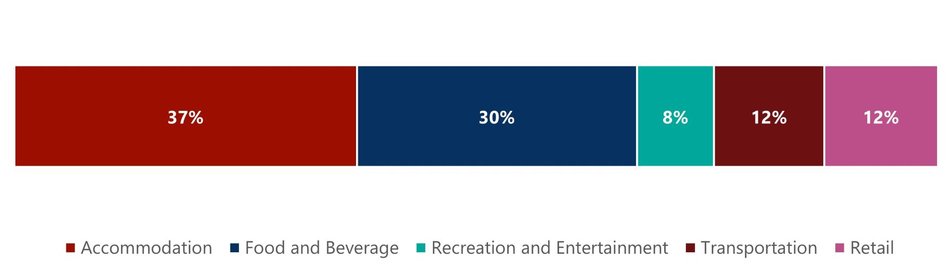
Share of total national expenditure (2019) 8% 27% 21% 38% -
Average spend (2019) $780 $949 $1,040 $1,727 $1,133

Air Travel

Economic Indicators

Indicators 2020 2021 2022
GDP - per capita $52,093 $57,748 $55,479
GDP - YoY Growth Rate -0.6% 10.9% -3.9%
Exchange Rate (CAD/EUR) (annual average) $1.53 $1.48 $1.37
Unemployment Rate (annual average) 4.9% 4.2% 3.6%
Inflation Rate (annual average) 1.3% 2.7% 9.6%

Traveller Characteristics

Seasonality (2019)


Purpose of Visit (2019)